2.5. Plotting with matplotlib#
2.5.1. Learning Goals#
After going through this notebook, you should be able to:
import matplotlib in a Jupyter Notebook
Make a basic plot of a 1D function with matplotlib
Change the size of a maplotlib plot
Change font sizes in matplotlib
Change tickmarks
Add a legend
Add labels to axes
2.5.2. Importing libraries#
matplotlib is a python library used for making plots. It is not native to python and thus we must tell our python kernel to import it. In addition, and something specific to Jupyter Notebooks, we will have to tell the notebook that we want to display the plot inline
import matplotlib.pyplot as plt
%matplotlib inline
---------------------------------------------------------------------------
ModuleNotFoundError                       Traceback (most recent call last)
Cell In[1], line 1
----> 1 import matplotlib.pyplot as plt
      2 get_ipython().run_line_magic('matplotlib', 'inline')

ModuleNotFoundError: No module named 'matplotlib'
while we are at it we will import numpy
import numpy as np
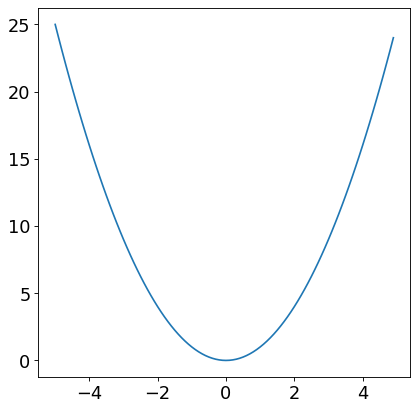
2.5.3. Basic plotting#
Let’s plot \(f(x) = x^2\). To have a computer do this, we must explicitly define our \(x\) values and compute the corresponding \(f(x)\) value.
# create a list of x values
xValues = []   # initialize list
for i in range(100):
    xValues.append(-5 + i*0.1)
print(xValues)
[-5.0, -4.9, -4.8, -4.7, -4.6, -4.5, -4.4, -4.3, -4.2, -4.1, -4.0, -3.9, -3.8, -3.7, -3.5999999999999996, -3.5, -3.4, -3.3, -3.2, -3.0999999999999996, -3.0, -2.9, -2.8, -2.6999999999999997, -2.5999999999999996, -2.5, -2.4, -2.3, -2.1999999999999997, -2.0999999999999996, -2.0, -1.9, -1.7999999999999998, -1.6999999999999997, -1.5999999999999996, -1.5, -1.4, -1.2999999999999998, -1.1999999999999997, -1.0999999999999996, -1.0, -0.8999999999999995, -0.7999999999999998, -0.7000000000000002, -0.5999999999999996, -0.5, -0.39999999999999947, -0.2999999999999998, -0.1999999999999993, -0.09999999999999964, 0.0, 0.10000000000000053, 0.20000000000000018, 0.3000000000000007, 0.40000000000000036, 0.5, 0.6000000000000005, 0.7000000000000002, 0.8000000000000007, 0.9000000000000004, 1.0, 1.1000000000000005, 1.2000000000000002, 1.3000000000000007, 1.4000000000000004, 1.5, 1.6000000000000005, 1.7000000000000002, 1.8000000000000007, 1.9000000000000004, 2.0, 2.1000000000000005, 2.2, 2.3000000000000007, 2.4000000000000004, 2.5, 2.6000000000000005, 2.7, 2.8000000000000007, 2.9000000000000004, 3.0, 3.0999999999999996, 3.200000000000001, 3.3000000000000007, 3.4000000000000004, 3.5, 3.5999999999999996, 3.700000000000001, 3.8000000000000007, 3.9000000000000004, 4.0, 4.1, 4.200000000000001, 4.300000000000001, 4.4, 4.5, 4.600000000000001, 4.700000000000001, 4.800000000000001, 4.9]
# determine f(x) values
yValues = []   # initialize list
for i in range(100):
    yValues.append(xValues[i]*xValues[i])   # f(x) = x^2 = x*x
print(yValues)
[25.0, 24.010000000000005, 23.04, 22.090000000000003, 21.159999999999997, 20.25, 19.360000000000003, 18.49, 17.64, 16.81, 16.0, 15.209999999999999, 14.44, 13.690000000000001, 12.959999999999997, 12.25, 11.559999999999999, 10.889999999999999, 10.240000000000002, 9.609999999999998, 9.0, 8.41, 7.839999999999999, 7.289999999999998, 6.759999999999998, 6.25, 5.76, 5.289999999999999, 4.839999999999999, 4.409999999999998, 4.0, 3.61, 3.2399999999999993, 2.8899999999999992, 2.5599999999999987, 2.25, 1.9599999999999997, 1.6899999999999995, 1.4399999999999993, 1.2099999999999993, 1.0, 0.809999999999999, 0.6399999999999997, 0.49000000000000027, 0.3599999999999996, 0.25, 0.1599999999999996, 0.0899999999999999, 0.039999999999999716, 0.009999999999999929, 0.0, 0.010000000000000106, 0.04000000000000007, 0.09000000000000043, 0.16000000000000028, 0.25, 0.36000000000000065, 0.49000000000000027, 0.6400000000000011, 0.8100000000000006, 1.0, 1.210000000000001, 1.4400000000000004, 1.690000000000002, 1.960000000000001, 2.25, 2.560000000000002, 2.8900000000000006, 3.2400000000000024, 3.610000000000001, 4.0, 4.410000000000002, 4.840000000000001, 5.290000000000004, 5.760000000000002, 6.25, 6.7600000000000025, 7.290000000000001, 7.840000000000004, 8.410000000000002, 9.0, 9.609999999999998, 10.240000000000007, 10.890000000000004, 11.560000000000002, 12.25, 12.959999999999997, 13.690000000000008, 14.440000000000005, 15.210000000000003, 16.0, 16.81, 17.640000000000008, 18.490000000000006, 19.360000000000003, 20.25, 21.160000000000014, 22.09000000000001, 23.040000000000006, 24.010000000000005]
# plot
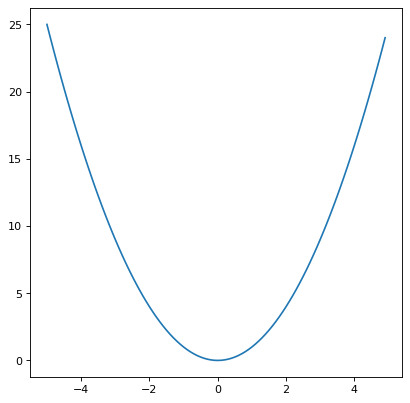
plt.plot(xValues,yValues)
plt.show();
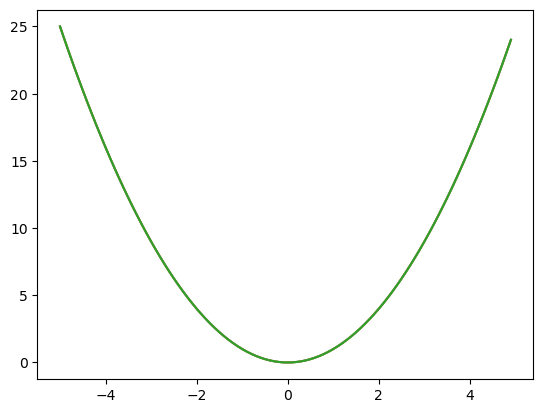
The above lists and plots could also be all done in one code snippet. I will do so below and also use numpy routines and operations to make the code look cleaner.
x_vals = np.arange(-5,5,0.1)
y_vals = x_vals**2
plt.plot(x_vals,y_vals);
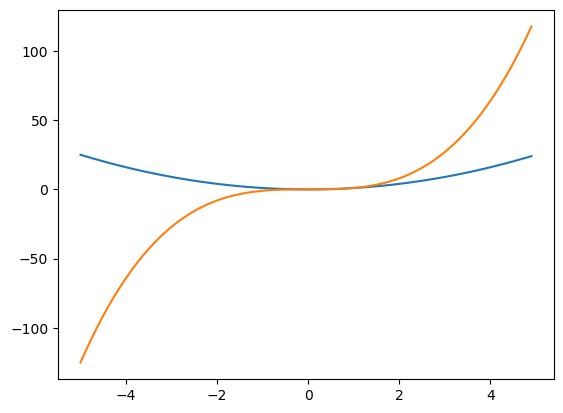
2.5.4. Multiple curves on the same plot#
x_vals = np.arange(-5,5,0.1)
y_vals_1 = x_vals**2
y_vals_2 = x_vals**3
plt.plot(x_vals,y_vals_1)
plt.plot(x_vals,y_vals_2)
plt.show();
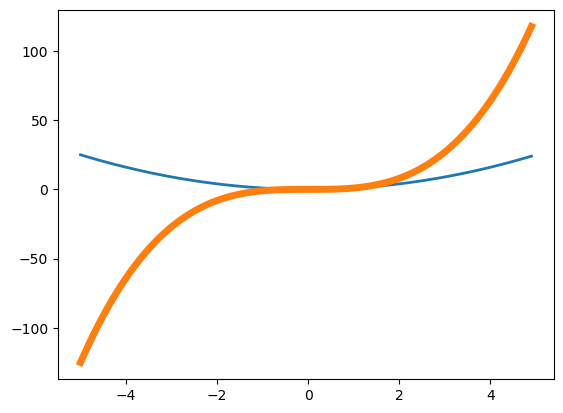
2.5.5. Changing linewidth#
x_vals = np.arange(-5,5,0.1)
y_vals_1 = x_vals**2
y_vals_2 = x_vals**3
plt.plot(x_vals,y_vals_1,lw=2)
plt.plot(x_vals,y_vals_2,lw=5)
plt.show();
2.5.6. Changing the size of the plot#
What I mean by size, here, is the image size. If you want to plot a larger domain/range you must simply change the number of x and y values you compute.
There are likely an almost infinite number of ways of changing the image size of a matplotlib plot. Here we will use the approach of declaring a figure object and then modifying that object.
# declare a figure object and set the figure size
fig = plt.figure(figsize=(6,6),dpi=80)
plt.plot(x_vals,y_vals)
plt.show();
2.5.7. Changing the font size in matplotlib plots#
Changing the fontsizes in matplotlib can be tricky because one can change the font size of different parts of the plot in different spots. For the current plot, we only have text for along our axes so we will modify those. We will, however, modify the default fontsize which will affect our subsequent plots as well.
# declare a figure object and set the figure size
fig = plt.figure(figsize=(6,6),dpi=80)
# update default font size to 16
plt.rcParams.update({'font.size': 16})
# do the plotting
plt.plot(x_vals,y_vals)
plt.show();